

Self-driving cars and driver-assist systems now log thousands of federally reported crashes a year. Austin sits near the top of the list for where those crashes happen. The most reliable self-driving car accident statistics come straight from two sources: NHTSA’s crash-reporting database and Waymo’s own published safety data. Together, they give a clearer picture of Texas roads than most headlines do. This update pulls directly from both sources. It shows what the numbers say, what they don’t say, and what they mean if you’re hurt in a crash involving one of these vehicles. LGR Law Firm represents injured people across Austin and Central Texas in autonomous and self-driving vehicle claims. We track this data because it shapes how those claims get built and proven. LGR Law Firm is not involved in producing or reviewing the crash data described here, and this article summarizes public NHTSA and company-published sources.
How Regulators Track Self-Driving and Driver-Assist Crashes
Two different technologies get lumped together in most news coverage. The data keeps them separate.
NHTSA requires manufacturers to report crashes under its Standing General Order on Crash Reporting. The rule splits crashes into two categories that follow the SAE levels of driving automation. Automated Driving Systems (ADS) are the Waymo-style robotaxis that operate without a human driver. Level 2 Advanced Driver Assistance Systems (ADAS) include Tesla Autopilot and Full Self-Driving (Supervised), which require an attentive driver at all times. A crash must be reported if two things are both true. The driving-automation system was in use within 30 seconds of the crash, and the crash caused certain property damage, an injury, or a fatality.
NHTSA is explicit about one limitation worth repeating here. Reporting entities don’t have to disclose how many vehicles they operate or how many miles those vehicles drove. That means the raw crash counts below can’t be turned into a “crash rate.” They also can’t be used to rank manufacturers against each other. A company with more connected vehicles and better telemetry will report more crashes simply because it knows about more of them. That doesn’t mean its vehicles crash more often.
The reporting timeline itself tells you something. Under the current rules, manufacturers must report the most severe crashes to NHTSA within five days. That covers crashes involving a fatality, an air bag deployment, or a hospital visit. Less severe crashes are reported monthly. NHTSA built that faster track to get early notice of the crashes most likely to reveal a safety defect. That’s generally the same category of crash where an injured person’s own evidence needs to be locked down fast, before it can be lost.
The National Numbers: 3,483 Reported Incidents in 13 Months
We pulled NHTSA’s incident-report data directly from its public CSV files on September 23, 2026. The data covers June 16, 2025 through July 15, 2026, the 13 months ending July 15, 2026.
ADS (self-driving, no human driver): 1,405 incident reports. Waymo accounted for 1,155 of them, or 82%. Avride (88), Zoox (63), and Tesla’s own robotaxi service (46) came next. Most were minor. 1,168 reports, or 83%, were logged as property damage with no injury reported. One fatality report and four serious-injury-with-hospitalization reports appear in the national ADS data for this period.
Level 2 ADAS (driver-assist, human driver required): 2,078 incident reports. Tesla accounted for 1,780 of them, or 86%. General Motors, Ford, BMW, and Subaru made up most of the rest. Severity is harder to pin down here — 89% of ADAS reports list the injury outcome as “Unknown.” NHTSA explains why. Level 2 systems are mostly installed in privately owned cars with limited telemetry. Many crashes are only known because a driver reported one after the fact, not because the vehicle transmitted the data automatically. Of the reports with a known severity, 27 involved a fatality and 25 involved a serious injury with hospitalization.
Tesla’s own explanation for its high count is worth including, because it cuts both ways. In its Vehicle Safety Report, Tesla says its vehicles are more connected than most competitors’. Its cars report crashes automatically through telemetry. Many other automakers only learn about a crash if a driver calls in or files a claim. That means Tesla’s raw count reflects better detection as much as it reflects actual crash volume. That’s exactly the kind of comparison NHTSA warns readers not to make between manufacturers.
KEY TAKEAWAY
In the 13 months ending July 15, 2026, NHTSA logged 1,405 self-driving (ADS) crash reports and 2,078 driver-assist (Level 2 ADAS) crash reports nationwide. Most self-driving reports were logged as property damage with no injury reported. Driver-assist severity data is far less complete — 89% of those reports don’t have a confirmed injury outcome on file.
Texas and Austin: Where the Reports Cluster
Texas shows up disproportionately in this data. That tracks with how much testing and deployment is happening here.
Texas ranked second among all states for ADS reports, behind only California. It accounted for 311 of the 1,405 national ADS reports, about 22%. Texas also ranked second for Level 2 ADAS reports, again behind only California. It accounted for 262 of the 2,078 national ADAS reports. Arizona ranked third in ADS reports at 179. Four of the 27 national ADAS fatality reports in this window were filed in Texas. California had the most at six, and Texas ties Florida at four.
Austin’s share of that traffic comes largely from Waymo. Through March 2026, Waymo had logged 15.789 million rider-only miles in Austin, as part of its published safety impact data. Austin is one of only five metro areas where the company runs large-scale robotaxi service. The other four are Phoenix, the San Francisco Bay Area, Los Angeles, and Atlanta. California adds a second layer of reporting on top of the federal numbers. The California DMV requires manufacturers testing there to file collision reports directly with the state. That’s part of why the federal NHTSA data above is the best public benchmark for comparing Texas to other states.
What Waymo’s Own Safety Data Shows
Waymo publishes its own safety comparisons, built on NHTSA-reported crash data and a peer-reviewed methodology. It’s company-published data, so it’s worth reading with that in mind. The underlying crash counts still come from the same federal reporting system covered above.
Waymo compares its 220.6 million total rider-only miles to a human-driver benchmark over the same distance and cities. Here’s what it reports:
- 94% fewer crashes involving a serious injury or worse (47 fewer).
- 82% fewer crashes involving an airbag deployment (305 fewer).
- 82% fewer crashes involving any reported injury (707 fewer).
- 93% fewer pedestrian-injury crashes (76 fewer).
- 84% fewer cyclist-injury crashes (48 fewer).
- 84% fewer motorcycle-injury crashes (32 fewer).
In Austin specifically, Waymo reports a serious-injury-or-worse rate of 0.00 incidents per million miles. The human benchmark for Austin is 0.17. For any reported injury, Waymo’s Austin rate is 0.70 per million miles against a benchmark of 3.35. Waymo says its comparisons apply a 32% adjustment for known underreporting in human crash data, and use a 95% confidence interval.
KEY TAKEAWAY
Waymo’s own safety data claims a 94% reduction in serious-injury crashes compared to human drivers, over the same 220.6 million miles, including Austin-specific numbers. That’s the company’s methodology, not an independent government finding. It still draws on the same federal crash-reporting base that NHTSA publishes.
What the Numbers Don’t Tell You
None of this data answers the question that decides a case: who was at fault, and why.
A report filed under NHTSA’s order only confirms one thing — a driving-automation system was active within 30 seconds of the crash. It doesn’t confirm that the system caused the crash, and it doesn’t mean anyone has determined fault. “Highest Injury Severity Alleged” is NHTSA’s own field name. The word “alleged” is doing real work here: these are self-reported figures from the manufacturer, not adjudicated findings.
That gap matters most in the cases that end up in a lawyer’s office. Most reported incidents involve property damage with no injury reported. The small share that involve real injuries or a fatality are different. In those cases, sensor data, software logs, and the manufacturer’s own telemetry become the evidence that decides what happened. That evidence needs to be preserved fast, before it’s overwritten or lost. Our guide to how liability gets assigned in Tesla Autopilot and other self-driving claims covers who can be held responsible under Texas law.
KEY TAKEAWAY
A crash report tells you a system was active, not who was at fault. That determination takes the same investigation any serious crash claim needs: reconstruction, data preservation, and a hard look at what the vehicle’s software did in the seconds before impact.
If You Were Hurt in a Self-Driving or Driver-Assist Crash
If you were hurt in a crash involving a Waymo, a Tesla using Autopilot or FSD, or any other automated or driver-assist vehicle in Austin, Terrell, or anywhere in Texas, LGR Law Firm is ready to look at your case. There’s no cost and no obligation. We track this data because it’s part of building these claims, but the numbers only tell part of the story. What matters is what happened in your specific crash. That takes a real investigation.
Call (512) 800-8000 for a free, no-obligation case review, or contact us online today.
Frequently Asked Questions
How many self-driving car crashes were reported to federal regulators in the past year?
Between June 16, 2025 and July 15, 2026, NHTSA logged 1,405 crash reports involving fully self-driving vehicles (ADS). It logged 2,078 reports involving Level 2 driver-assist systems like Tesla Autopilot. Both figures come from the agency’s public Standing General Order data. Most self-driving reports were logged as property damage with no injury reported. NHTSA cautions that these are raw counts. They aren’t adjusted for how many vehicles or miles each company operates, so they shouldn’t be read as a ranking of which company is safest.
Is Waymo safer than human drivers, according to the data?
Waymo’s own published safety data claims a 94% reduction in serious-injury-or-worse crashes compared to a human-driver benchmark. That’s over 220.6 million rider-only miles through March 2026. The analysis uses NHTSA-reported crash data, a peer-reviewed methodology, and a 32% adjustment for known underreporting in human crash data. It’s worth remembering this is Waymo’s own analysis of its own fleet, not an independent government finding. It still draws on the same federal crash-reporting system NHTSA publishes.
How many self-driving car crashes happened in Texas?
Texas ranked second among all states for both categories of federally reported crashes in the 13 months ending July 15, 2026. That’s 311 reports involving fully self-driving vehicles and 262 involving Level 2 driver-assist systems, both trailing only California. Four of the 27 nationwide fatality reports involving Level 2 systems in that window were filed in Texas. California had the most at six, and Texas ties Florida at four.
Why does Tesla show up in so many crash reports?
Tesla accounted for 1,780 of the 2,078 national Level 2 ADAS crash reports in the 13 months ending July 15, 2026 — about 86%. Tesla says this reflects its large, fully connected vehicle fleet. Its cars report crashes automatically through telemetry. Many competing automakers only learn of a crash when a driver reports it themselves. NHTSA has confirmed the reporting data isn’t adjusted for fleet size or miles driven. A high report count doesn’t necessarily mean a higher crash rate.
Do these crash numbers mean self-driving cars cause more accidents?
Not on their own. A report filed under NHTSA’s order only confirms that a driving-automation system was active within 30 seconds of a crash. It doesn’t establish that the system caused the crash, or that anyone has been found at fault. Most reported crashes, especially in the self-driving (ADS) category, involved no reported injury. Determining fault in a specific crash still takes an investigation — usually police reports, vehicle data, and expert reconstruction.
Has anyone died in a self-driving car crash in Texas?
NHTSA’s national data for the 13 months ending July 15, 2026 lists one fatality report involving a fully self-driving (ADS) vehicle, filed in Arizona. It lists 27 fatality reports involving Level 2 driver-assist systems nationwide, four of which were filed in Texas. These figures come from manufacturer-submitted reports. They reflect whether a driving-automation system was in use at the time of the crash, not a legal determination of fault.
Where can I find official self-driving car crash data?
NHTSA publishes the underlying incident-report data as downloadable CSV files on its Standing General Order page, updated monthly. Waymo publishes its own safety comparisons on its safety impact page. The California DMV publishes autonomous vehicle collision reports filed by companies testing there. All three sources are public and free to review.
Attorney responsible for this content: Tray Gober (Kenneth Parks Gober, III), Managing Partner, LGR Law Firm, 11940 Jollyville Road, Suite 220-S, Austin, TX 78759.
This information is for educational purposes and does not constitute legal advice. Every case is unique — contact our office for a free consultation about your specific situation. Past results do not guarantee future outcomes.
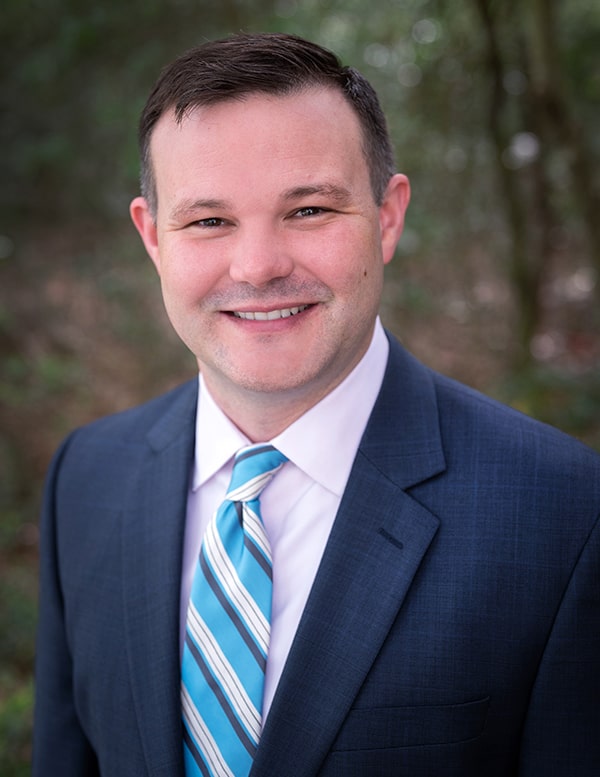
About The Author
Kenneth "Tray" Gober III, J.D., is the Managing Partner of Lee, Gober & Reyna, PLLC in Austin, Texas. A 2005 magna cum laude graduate of Texas A&M University and a cum laude graduate of Baylor Law School, Tray is admitted to the State Bars of Texas (Bar No. 24061986), Colorado, Louisiana and Pennsylvania. He is also admitted to the U.S. Supreme Court, U.S. Court of Appeals for the Fifth Circuit, U.S. District Court — Western District of Texas and U.S. District Court — Eastern District of Texas.
He represents personal injury clients across Texas in car accidents, truck accidents, autonomous vehicle claims, wrongful death, drunk driving collisions, premises liability, and product liability matters. He is one of Texas's most frequently quoted legal voices on the law surrounding autonomous vehicles and AI-driven transportation. Tray also served as an adjunct professor of Paralegal Studies at the University of Texas School of Law.